Leading Others
Org Charts That Don't Lie: Designing Teams People Want to Join
Your org chart is a work of fiction. The real chart is where communication actually flows. How to find your team's true lines and redesign around them.
· Leading Others · 8 min read
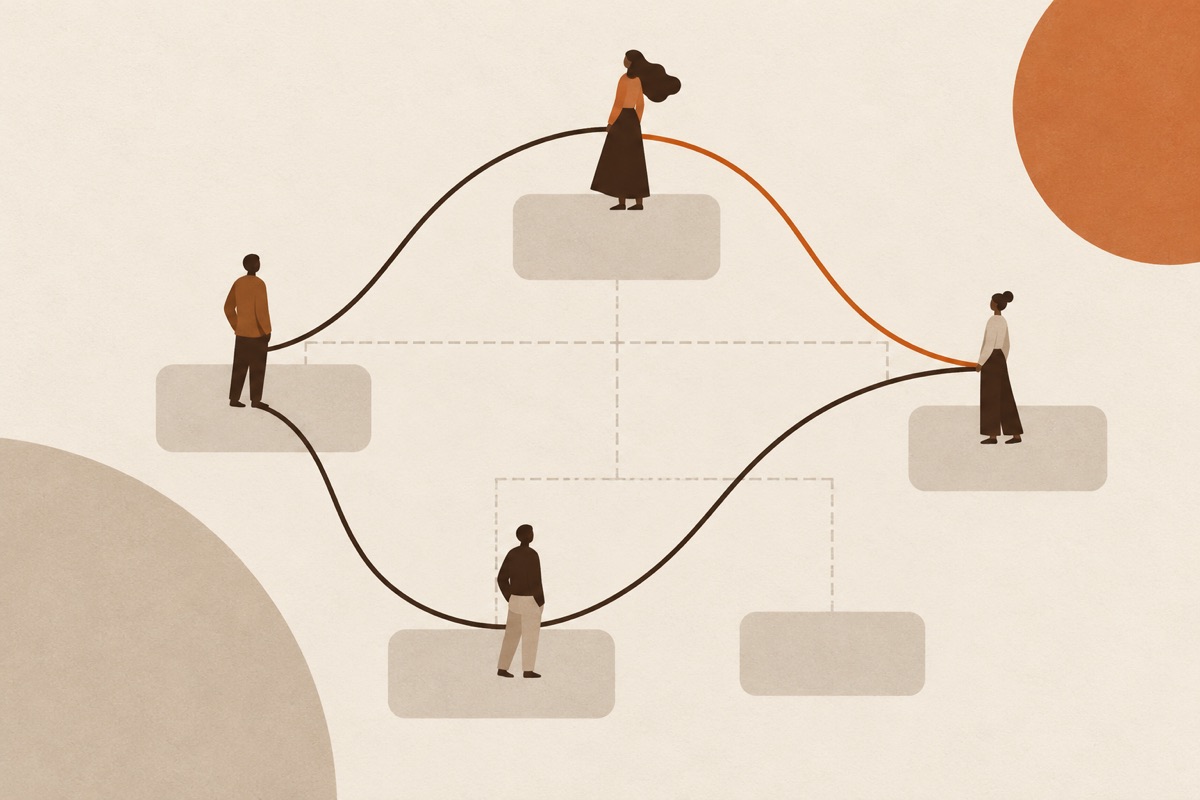
Your org chart is a work of fiction. Useful fiction — payroll needs it, lawyers need it — but read it as a description of how work actually happens and you’ll design teams for a company that doesn’t exist.
Here’s what a real org chart is: boxes, connected by reporting lines. Here’s what an org chart never shows: the paths information actually travels, where decisions really get made, who calls whom at 4 p.m. when something is on fire, which manager people quietly go to when they need the truth. The organization runs on those lines. They’re invisible on the document — and completely visible, within two weeks, to anyone who watches.
People don’t join boxes. People join lines — the conversations they’d be inside of, the access they’d have, the distance between their work and the decisions about their work. Design the lines and you’ve designed the team, whatever the boxes say.
Find the real chart
Before redesigning anything, draw the chart that’s true. Three observations, none requiring permission:
The call test. For the last ten real problems — a customer escalation, a spec conflict, a stalled launch — who actually got pulled in, in what order? Draw it. You’ll find people whose boxes are humble sitting at the center of every path, and people whose boxes are imposing sitting on no path at all. Both facts are design data.
The two-week watch. For two weeks, note where information arrives first. Not where it’s supposed to arrive — where it actually lands. The real chart’s hubs are the people who hear things early. If the official chart and the arrival pattern disagree, you’ve found the fiction, and the further they diverge, the more the divergence is costing you.
The translation count. For one recurring decision, count how many times it changes hands on its way from the person with the information to the person with the authority. Each handoff is a translation, and every translation loses something — context, nuance, urgency — while gaining delay and distortion. Three or more handoffs in a routine decision is an organizational defect wearing a process costume.
What broken lines cost
The costs are specific, not moral. When the official chart and the real lines disagree, you get the same three symptoms everywhere:
- Scramble. Work bounces between boxes — sent up for decisions that could be made where it started, routed through managers who add a forwarding step, parked with whoever’s least busy. From inside it feels like busyness. From above it looks like a team that can’t move.
- Invisible knowledge. The hubs — the people everything actually routes through — carry load the boxes don’t show. They burn out or leave, and the org discovers, in one bad week, that the “replaceable middle manager” was the chart’s real load-bearing wall.
- Quiet departures. Good people leave over lines, not boxes. They don’t resign from their title; they resign from the path their work had to travel — the translations, the delays, the distance from the decision. Exit interviews record it as “growth opportunity elsewhere.” It was line design.
Design the lines
Rebuild from the lines, four rules at a time:
Shorten the decision path first. The question isn’t “who should this report to” but “how many steps from the information to the decision.” Put authority where the information lives, with the shortest path you can honestly defend. Every step you remove pays daily, forever.
Design for the conversation, not the department. Group by the conversation that needs to happen often — the people who should be in one room because their work is one conversation — not by function, headcount symmetry, or what flatters the diagram. If two teams need each other daily and meet monthly, the boxes have lied again.
Fewer handoffs, each one real. A handoff is justified only when it crosses a genuine capability boundary — someone downstream can do something upstream can’t. Otherwise merge it. Half the “process” in most teams is handoffs defending boxes rather than serving work.
Make the lines visible and owned. Real lines, drawn, agreed. Who talks to whom, about what, on what cadence — and who owns keeping each line healthy. A line with an owner gets repaired when it frays. A line nobody owns frays silently until something expensive falls through it, and the meeting that follows will be about the falling, not the fraying.
The dignity clause
One more thing, and it’s the part that makes teams people want to join rather than merely staff. Line design is a statement about trust. Every shortened path, every merged handoff, every visible line says: we trust the people close to the work. Every lengthened approval chain says the opposite, whatever the values slide claims. Your team reads the org design as your real values statement — they’ve never once confused the two documents.
The best structure test I know isn’t on any consultant’s checklist: can the newest competent person see, within their first month, a short honest line between what they notice and what gets decided? If yes, the structure works, whatever it looks like. If no, it doesn’t, however elegant the boxes.
This week's practice
Draw your team's real chart: who actually communicates with whom, weekly, about what. Circles and lines on paper — boxes optional, honesty mandatory. Then overlay the official chart and mark every place the two disagree. The disagreements are your design debt, ranked by how much translation they cost.
Then fix one line this week — just one. Remove a handoff, shorten one decision path, or formally connect two people who've been routing through you because no line existed. Tell both people why. One repaired line is a demonstration; demonstrations recruit faster than decks.
Foundations & further reading
The ideas here are my synthesis. The research that rhymes with them isn't new — if you want to go deeper than the essay, these are the sources I'd hand you first.
- Robert Cross & Andrew Parker, The Hidden Power of Social Networks (2004) — Organizational network analysis: who actually goes to whom for what. The diagnostic method behind every honest org-chart redesign.
- Henry Mintzberg, Structure in Fives (1983) — Five real structures behind the one-box chart, and the coordination mechanisms each actually runs on. Mintzberg drew the org chart under the org chart.
- Melvin Conway, How Do Committees Invent? (1968) — Conway's Law: organizations design systems that mirror their own communication structure. If the chart is wrong, the product will be too.